
 Written by Jeff on October 29, 2012 – 12:30 am
National and state polls have been all over the place since the beginning of September. As of this post, the Gallup tracking poll has governor Romney up by 4% while the Rand tracking poll has president Obama up by 6%. All of the other national polls are between these extremes. Indeed, today the HuffPost Model Estimate is 47.3% to 47.1% for Romney, which is essentially a tie. I want to reduce the uncertainty.
The logical place to look for a reduction in uncertainty is poll aggregators. Poll aggregators take available polls and reduce uncertainty by applying different complex statistical models for combining polls. One of the more complex poll aggregation models is Nate Silver’s at FiveThirtyEight. His model aggregates state polls, national polls, and economic data to generate the probability that a candidate will win the election. The details of his model, to my knowledge, are not publically available. So, although I admire his efforts at integrating empirical and theoretical information, lack of knowledge about the underlying model does little to reduce uncertainty for me.
At the opposite extreme is Real Clear Politics. Their methodology is very simple: average state and national polls for about the previous 10 days. I like the simplicity but mere averaging is problematic. Polls with different sample sizes should be weighted differently. Another problem is that they do not consider all the polls. They attempt to exclude partisan polls. In principle, this appears reasonable, but how do we know that partisan polls are really biased? Which ones are and which are not?
My favorite poll aggregator is the Princeton Election Consortium run by Sam Wang. Professor Wang aggregates only state polls, which provide the most information about the outcome of the presidential election for two reasons. First, a US president is elected by an Electoral College majority. Thus, the popular vote does not necessarily correspond to the electoral college vote. Second, state polls have relatively large sample sizes for small populations (when compared to national polls), so they provide more information about a given state and how the electoral college vote will go. Wang uses meta-analysis on state polls and unlike other poll aggregators, his methods are publically available. For these reasons, if I had to rely on any poll aggregator, it would be Princeton Election Consortium. Nevertheless, I still have some nagging uncertainty.
One reason for my continued uncertainty is the fluctuations in Wang’s Median EV estimator. As you can see, changes in the meta-margin correspond very closely to key events during the 2012 presidential campaign. Two changes are especially salient: The selection of Paul Ryan as Romney’s vice presidential running mate and the first presidential debate. Both involved fairly large changes in the meta-margin, but did they involve large changes in voter preferences? The Rand tracking poll indicates that changes in preferences between candidates is rather small and very noisy. A less scientific poll of the Xbox/YouGov panel also suggests that changes in voter’s preferences are small and noisy. Doug Rothschild and Doug Rivers suggest that relatively large changes seen in the polls may be driven by voter enthusiasm rather than changes in voter preferences. If this is the case, then the fluctuations we see in Wang’s meta-margin are driven largely by voter enthusiasm. If the vast majority of voters already know the two candidates and have a preference for one of them, then events such as picking a vice presidential running mate or presidential debates may affect voter enthusiasm much more than voter preferences.
Another concern about poll aggregation is bias in individual polls. For example, Alan Abramowitz has recently argued that Rasmussen is biased towards republican candidates. His points are good, but they only show that Rasmussen polls tend to be outliers for republican candidates. How do we know that they are outliers for this election cycle?
At one point, I thought it would be great to have an agent-based model of the voting population in the United States. I could model voter enthusiasm, the likelihood of answering phones for polls etc. Then I could test various assumptions made by polling groups to assess bias. I quickly realized that this was a fantasy. There were too many possible factors affecting voter preferences and enthusiasm and there is almost no theory to base such a model on.
What if almost all people already have a preference one way or another even a weak one? If so, then fluctuations in voter enthusiasm may allow us to detect weak voting preferences. During periods of high republican enthusiasm we may be able to detect weak republican preferences and during periods of democratic enthusiasm, we may be able to detect weak democratic preferences. If this hypothesis is correct, polls should be aggregated over longer periods of time, so that enough fluctuations in enthusiasm occur to detect weak presences one way or the other. With this in mind, I made two assumptions:
(1) The vast majority of the voting population had at least weak preferences for Romney or Obama by the time of the republican and democratic conventions. Aggregation of polls should therefore start around the 1st of September.
(2) By aggregating polls, especially over a long-period of time, biases in individual polls will tend to cancel out.
Based on these two assumptions, I decided to aggregate all state polls from approximately September 1, 2012 till the last polls before the election on November 6, 2012. The method of aggregation is described in the next section and in the subsequent section I report the results up to today.
METHODS
The state polls used in this analysis come from Pollster.com and Statewide opinion polling for the United States presidential election, 2012 from Wikipedia. For each state the sample sizes are combined as they become available. For some smaller states that traditionally lean strongly republican or democratic, there are few if any polls available. In those cases, a poll as old as June, 2012 may be used. In cases where there are no polls either Pollster.com’s estimate is used or the voting percentages from the last election.
From the aggregated polls for each state, new percentages are calculated for Obama and Romney. The aim is to calculate a P-value for the difference in the percentage favoring one candidate over the other. In other words, if a difference is observed in the polling data, how probable is it assuming that there is no difference at all?
To calculate a P-value for each state from the polling data, we must calculate the standard error of the differences in percentage, which is given by the following equation:

where p and q are the observed frequencies for the two candidates and N is the aggregate sample size. A P-value can then be calculated using a cumulative Gaussian distribution with parameters SE and the difference between p and q. A state is decided for one candidate or the other if the calculated P-value is less than alpha = 0.01 or if there is no polling data available and the state is traditionally a strong lean to either republican or democratic candidates.
RESULTS
The link to the Table 1 provides the aggregate sample sizes, the calculated percentages for Obama and Romney, the difference in percentages, and where possible, whether the difference is statistically significant.
State Polls 10-28-12 (Table 1)
Figure 1 is a graph of the difference between Obama and Romney in Ohio and Figure 2 is the same for Florida. For Ohio, the difference is about 3% in favor of Obama and it is statistically significant. For Florida, there is about a .5% difference in favor of Obama, but it is not statistically significant.
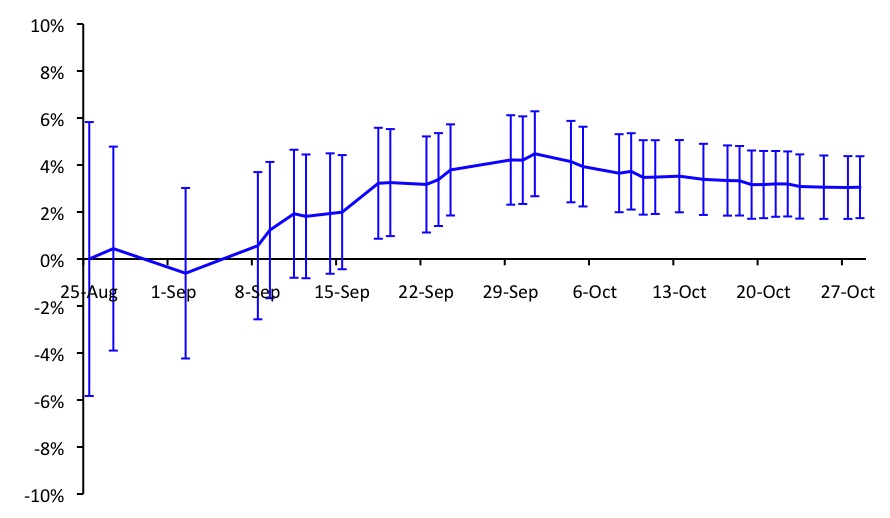
Figure 1. Percentage difference between Obama and Romney for Ohio with 99% confidence intervals.
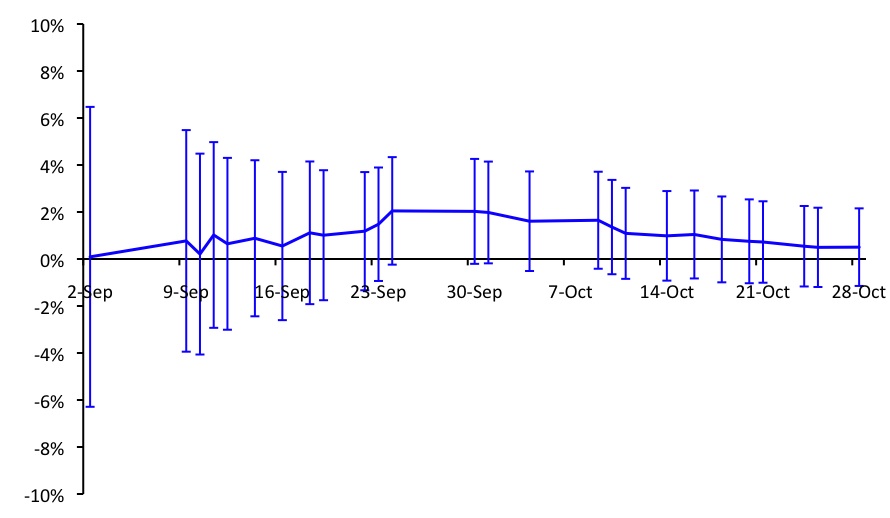
Figure 2. Percentage difference between Obama and Romney for Florida with 99% confidence intervals..
DISCUSSION
One of the surprising results is that there are only two tossups states: Florida and Colorado. For all other states, the percentage differences between Obama and Romney are statistically significant. Thus, based on the polling results as of today, Obama would win 294 electoral votes and Romney 206. The differences between Obama and Romney for Florida and Colorado are not statistically significant for alpha = 0.01, but they are both in the direction of Obama, so my best guess as of today is 332 electoral votes for Obama and 206 for Romney. There are currently only two polls for Nebraska. One reports a tie between Obama and Romney in the 2nd district and the other reports a 3% lead for Obama. Based on this scant evidence, the electoral vote distribution might end up 333 electoral votes for Obama and 205 for Romney as of today.
It is also possible to use the state data to estimate the popular vote. I weighted each state by its 2008 turnout, which yielded as state-based estimate for Obama of 48.3% and for Romney of 45% with a 3.3% difference. This is in striking contrast to the current average of the national polls. It will be interesting to see whether the national polls begin to converge on the state-based poll estimate as we approach the election.
There are many ways that this analysis could go wrong. It could be that changes in poll numbers are primarily driven by changes in preferences for Obama or Romney rather than changes in enthusiasm. There could also be systematic biases in the polls due to systemic sampling problems, bad assumptions, or over representation of polls from some polling groups. However, if assumptions (1) and (2) are correct, then this approach to poll aggregation should provide an accurate estimation of the presidential election results.
I wonder if some of this data could have been taken from a feed, it’s scattered across the net and other peoples websites, unless you’re the content’s creator?
Yes, all of the polls that I pooled came from came from Pollster. Anyone can download polls and specify a window of time. You can also automate the process since they let you access their data base.